 Contact
Harbor International Compounders ETF Strategy Profile
March 08, 2024Ticker: OSEA | March 2024
Download this Strategy Profile as a PDF | Visit OSEA Product Page | Contact Your Harbor Representative
| Average Annual Returns as of 12/31/2023 | |||||||||
|---|---|---|---|---|---|---|---|---|---|
| 3 Months | YTD | 1 Yr. | 3 Yr. | 5 Yr. | 10 Yr. | Since Inception | Inception Date | Gross Expense Ratio | |
| Harbor International Compounders ETF (NAV) | 14.94% | 21.07% | 21.07% | N/A | N/A | N/A | 23.83% | 09/07/2022 | 0.55% |
| Harbor International Compounders ETF (Market) | 14.98% | 20.89% | 20.89% | N/A | N/A | N/A | 23.86% | 09/07/2022 | 0.55% |
| MSCI All Country World Ex. US (ND) Index | 9.75% | 15.62% | 15.62% | N/A | N/A | N/A | 16.85% | 09/07/2022 | |
| Morningstar US Fund Foreign Large Blend | 9.81% | 16.29% | 16.29% | 2.46% | 7.33% | 3.67% | 4.66% | 09/01/1986 | |
| Morningstar US Fund Foreign Large Growth | 12.10% | 16.09% | 16.09% | -2.50% | 7.81% | 4.52% | 6.05% | 09/01/1986 | |
| Related Performance – Composite net of all OSEA operating expenses* | 14.88% | 20.79% | 20.79% | 3.83% | 12.24% | 6.91% | 13.16% | 09/01/1986 | |
| Related Performance – Composite gross of all OSEA operating expenses* | 15.03% | 21.46% | 21.46% | 4.40% | 12.86% | 7.50% | 13.79% | 09/01/1986 | |
Performance data shown represents past performance and is no guarantee of future results. Past performance is net of management fees and expenses and reflects reinvested dividends and distributions. Investment returns and principal value will fluctuate and when redeemed may be worth more or less than their original cost. Returns for periods less than one year are not annualized. Current performance may be higher or lower and is available through the most recent month end at harborcapital.com or by calling 800-422-1050.
For most current performance please click here.
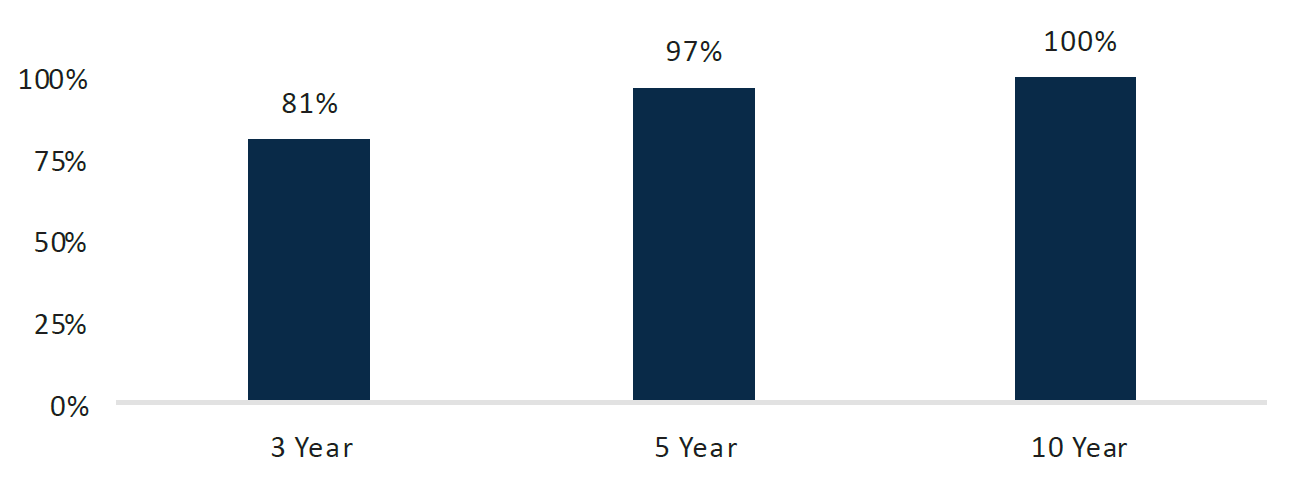
- C WorldWide’s (“CWW”) strategy has consistently delivered excess returns relative to the benchmark, outperforming over most rolling periods over the past 20 years.
- While C WorldWide has outperformed the MSCI ACWI ex US Index, it has also demonstrated a lower correlation to U.S. equities than the index. Furthermore, CWW has demonstrated a lower correlation to U.S. equities than all but a few Foreign Large Cap strategies (including Foreign Large Value, Blend and Growth categories).
CWW Int’l Composite (net) Percentage of Periods Outperform
MSCI ACWI ex US Index
Rolling Periods - 20 Years Ending 12/31/2023
Performance data shown represents past performance and is no guarantee of future results.
Related Performance CWW International Equity, Foreign Large Cap Peers, MSCI ACWI ex -US
Trailing 20 Years Ending 12/31/2023
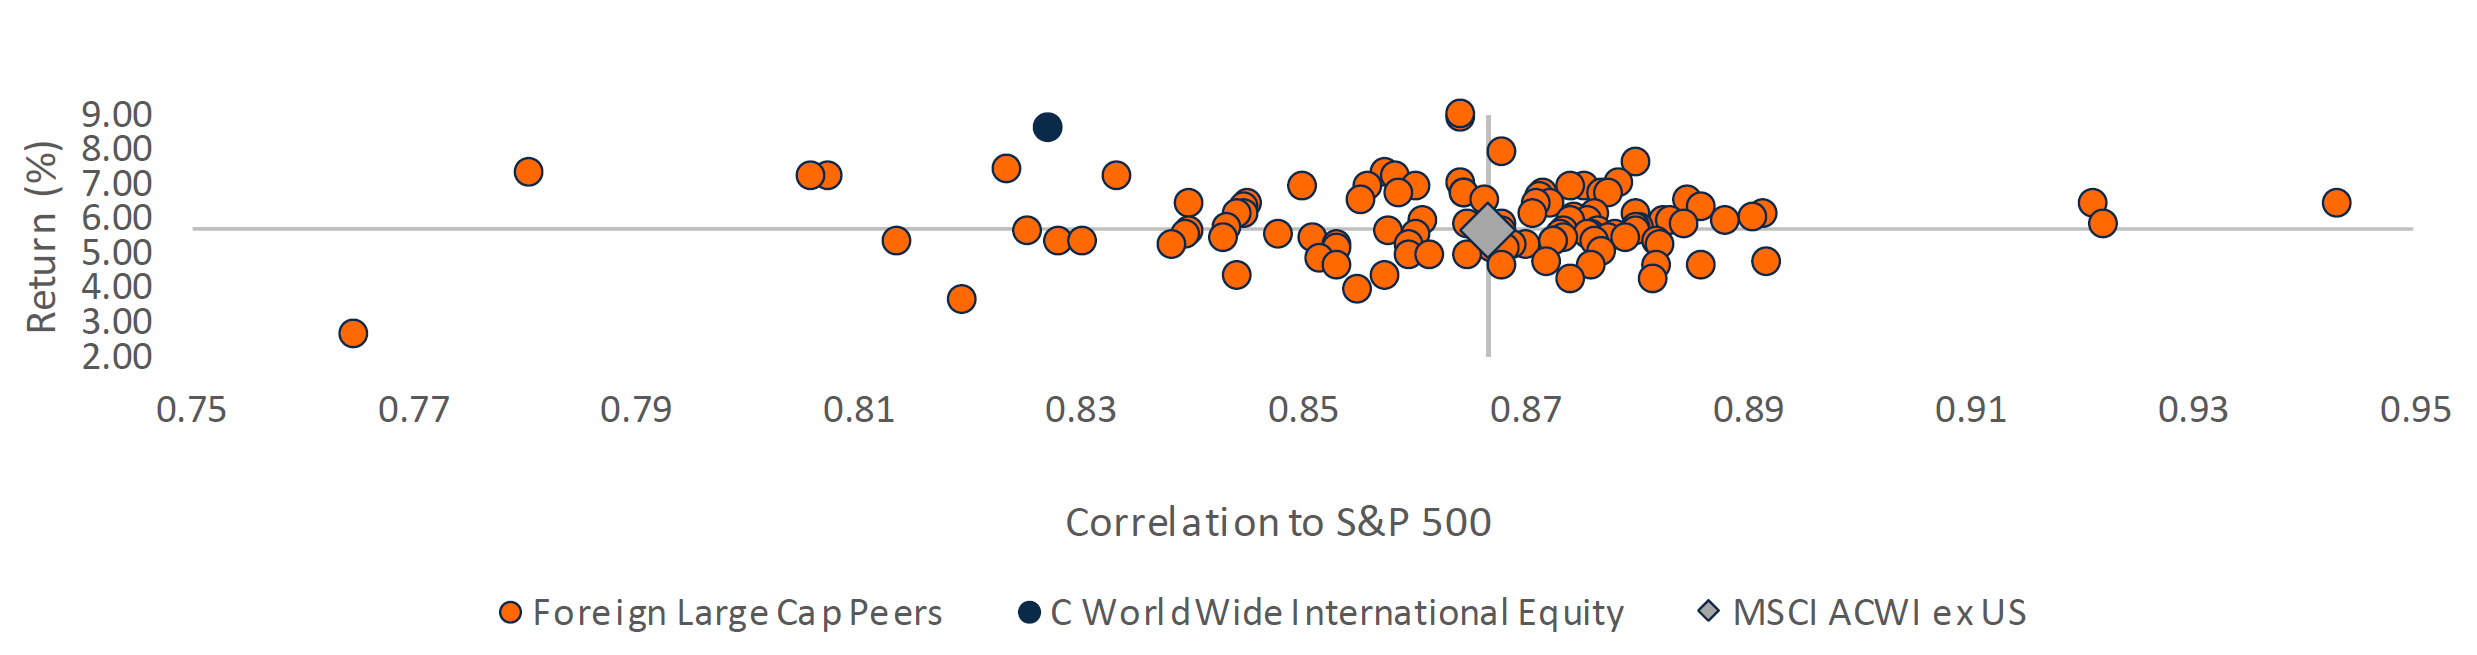
Source: Morningstar Direct. December 2023. Foreign Large Cap Peers is of Morningstar.
*This is not
the performance of Harbor International Compounders ETF. As of December 31, 2023 the Composite was composed of
5 account(s), totaling approximately $476 million. The inception date of the Composite was September 1, 1986.
To calculate the performance of the Composite net of all operating expenses, the actual annualized gross Fund
operating expenses payable by the Fund as of the most recent prospectus dated 03/31/2023.
The previous
table(s) presents the past performance of a composite of certain accounts managed by C WorldWide Asset
Management (CWW), the Subadvisor to the Harbor International Compounders ETF. The C WorldWide International
Composite (“Composite”) is comprised of all fee-paying accounts under discretionary management by CWW that
have investment objectives, policies and strategies substantially similar to those of the Fund. The Composite
consisted of 5 accounts as of December 31, 2023. Returns are presented in U.S. Dollars and include
reinvestment of interest, dividends and any other distributions. Gross performance data shown does not reflect
the deduction of fees and expenses. Because the gross performance data shown does not reflect the deduction of
investment advisory fees paid by the accounts comprising the Composite and certain other expenses that would
be applicable to mutual funds, the net performance data may be more relevant to potential investors in the
Fund in their analysis of the historical experience of CWW in managing portfolios with investment strategies
and techniques substantially similar to those of the Fund. The accounts comprising the Composite have
different fees and expenses than those of the Fund used to calculate the net performance data shown. The net
composite performance shown would be lower to the extent the related funds or accounts were subject to higher
fees and expenses.
The historical performance of the Composite is not that of Harbor International
Compounders ETF and is not necessarily indicative of the Fund’s future results.
The Fund commenced
operations on September 6, 2022 and the Fund’s actual performance may vary significantly from the past
performance of the Composite. While the accounts comprising, the Composite incur inflows and outflows of cash
from clients, there can be no assurance that the continuous offering of the Fund’s shares and the Fund’s
obligation to redeem its shares will not adversely impact the Fund’s performance. Also, not all of the
accounts comprising the Composite are subject to certain investment limitations, diversification requirements
and other restrictions imposed by the Investment Company Act of 1940 and the Internal Revenue Code. If these
limitations, requirements and restrictions were applicable to all of the accounts in the Composite, they may
have had an adverse effect on the performance results of the Composite. However, CWW does not believe that
such accounts would have been managed in a significantly different manner had they been subject to such
investment limitations, diversification requirements and other restrictions.
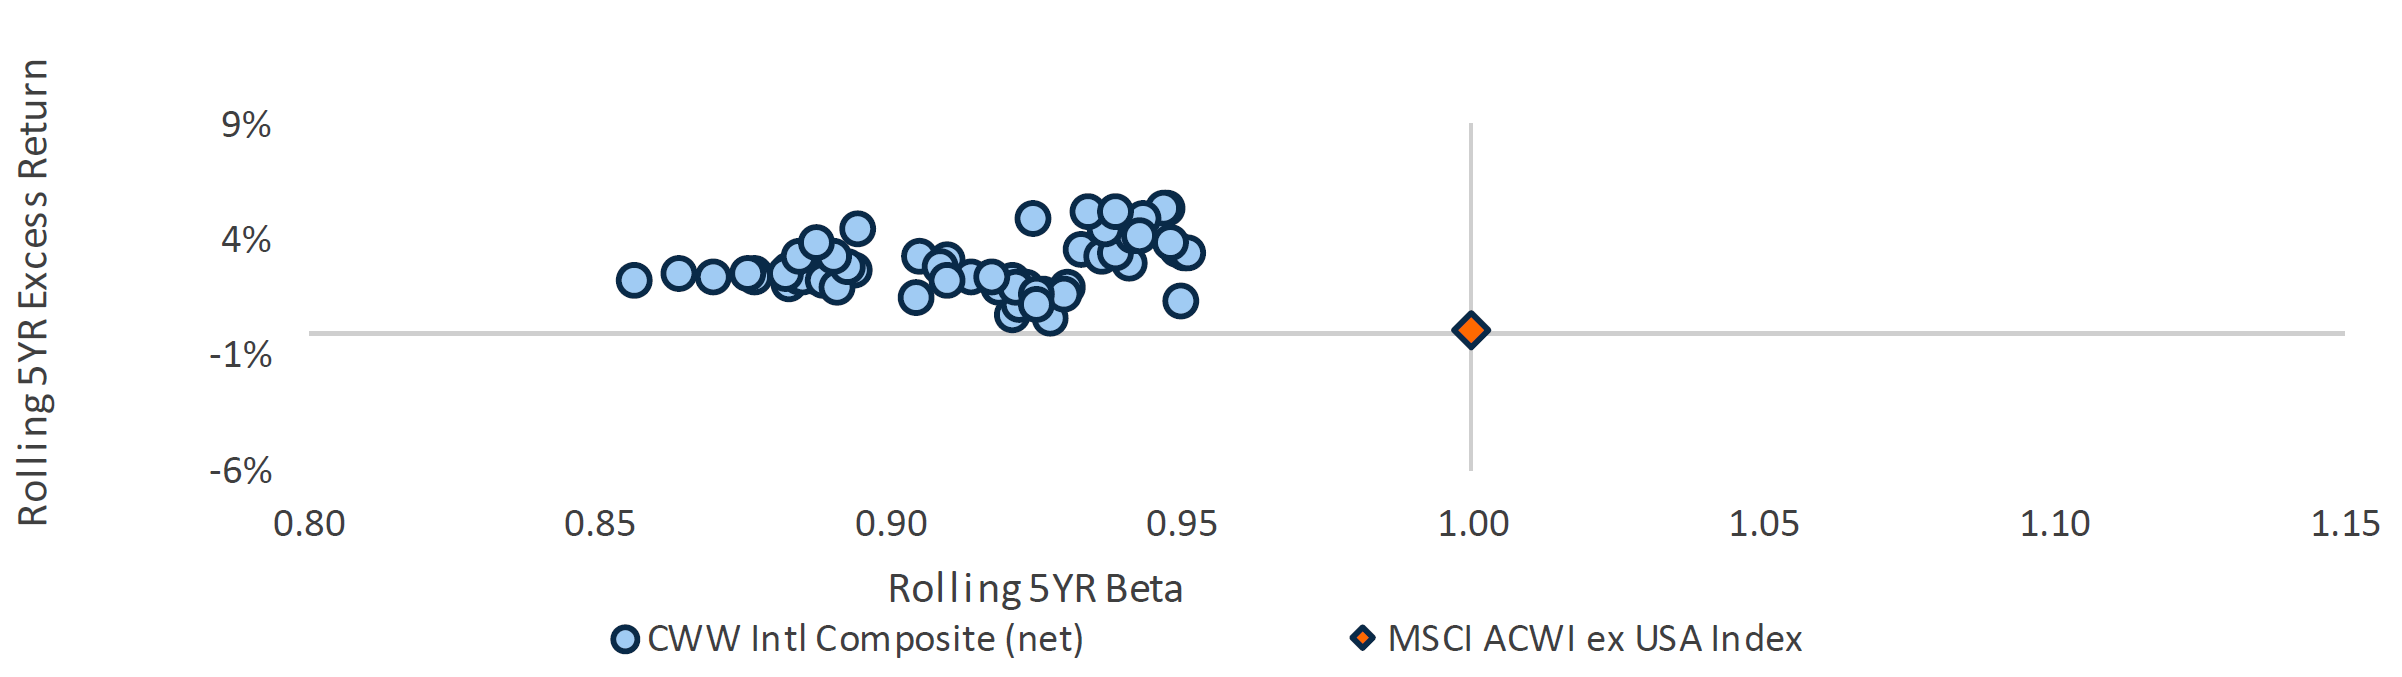
CWW’s disciplined, risk-managed process has generated outperformance with lower beta risk over time. On a rolling 5-year basis, the strategy has produced positive excess returns versus the MSCI ACWI ex US Index while exhibiting a rolling 5-year beta lower than 1.00 over the last decade.
Over this period, the strategy’s average rolling 5-year excess return and beta were +2.76% and 0.91, respectively.
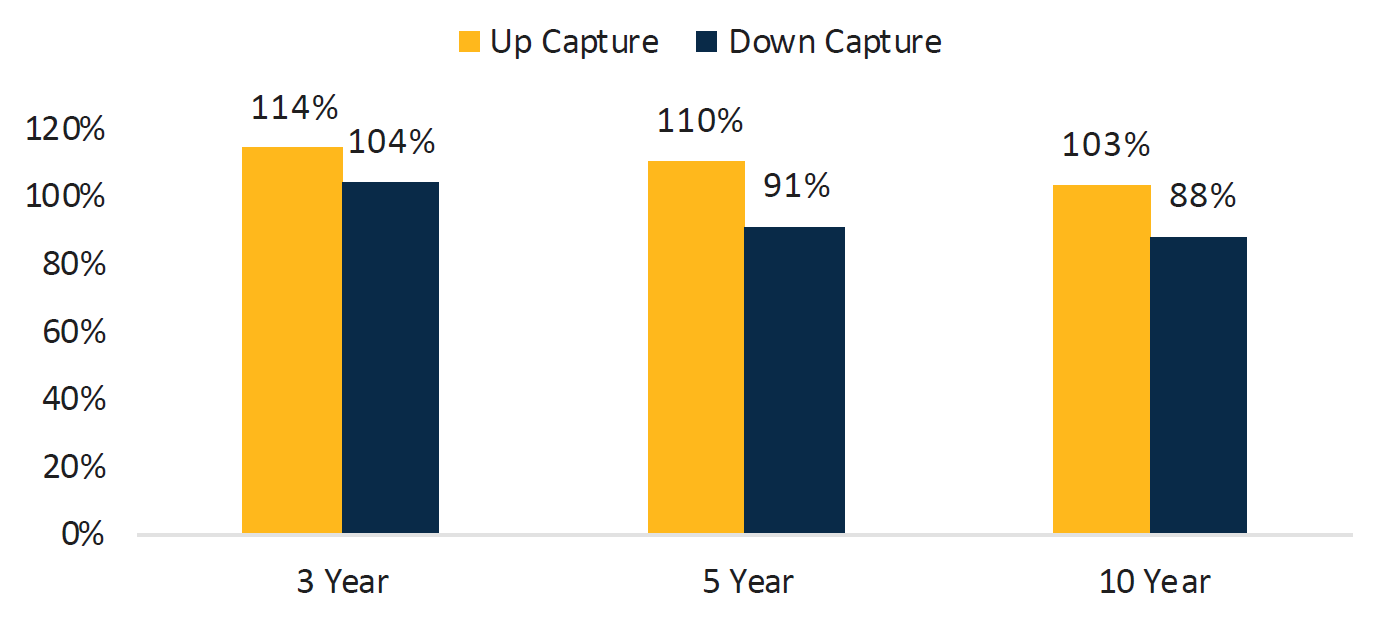
CWW’s strategy has captured greater than 100% during up-markets and helped hedge during down-markets over the long-term relative to the MSCI ACWI ex US Index.
vs. MSCI ACWI ex USA Index as of 12/31/2023
Performance data shown represents past performance and is no guarantee of future
results.
vs. MSCI ACWI ex USA Index
Rolling 5YR Beta & Excess Return: Jan 2014 - Dec 2023 (Monthly)
- Founded in 1986, C WorldWide is an equity boutique investment firm based in Copenhagen, Denmark.
- Since the firm’s inception, AUM has grown to over $17 billion (as of 12/31/2023). The firm has over three decades of experience employing a disciplined and consistent process.
- The firm’s PMs average 30 years of industry experience and 22 years of firm tenure and are part of the firm’s 24-person investment team.
- OSEA is a high conviction portfolio employing a 30-stock maximum. This approach ensures a constant competition for capital, ensuring each holding continuously earns its place in the portfolio.
- It’s not the magnitude of growth, it’s the sustainability of growth. The team is seeking companies with competitive advantages, strong governance and clear long-term strategies resulting in the ability to compound earnings growth over time.
- C WorldWide devotes resources explicitly to focus on identifying generational trends (20 – 40 years) and themes (at least five years, often longer). These thematic insights drive C WorldWide toward attractive addressable markets with sustainability of growth.
- These themes are seamlessly integrated with C WorldWide’s disciplined, bottom-up fundamental research; the team will never invest in low conviction stocks regardless of conviction in the theme.
The process starts and ends with a portfolio of C WorldWide’s highest conviction ideas – maximum 30 holdings. One in, one out approach is a result of competition for capital.
| High Conviction Portfolio 25-30 holdings |
Idea Generation (Full investment team, 24 people – meeting twice a week) |
Building Conviction Global Research Team & core members* - meeting every 4th week |
Global Decision Team & Meeting Meeting every 10th day or more often |
Portfolio Construction 25-30 holdings |
|---|---|---|---|---|
|
|
|
|
|
*The core members of the Global Research Meeting are the four PM’s in global decision team Bo Knudsen, Bengt Seger, Mattias Kolmand Peter O’Reilly. Supplemented with global PM Jakob Greisen and Leemon Wu, Senior Advisor Lars Wincentsen, Head of Research David Rindegren, Analyst Marcus Bellander and ESG Specialist Mette Bergenstoff Sletbjerg.
Conviction: maximum 30 stocks
Buy/Sell discipline: one in/one out
Global trends and themes
Tailwinds and headwinds drive bottom-up selection
Low turnover
Long-term investment horizon
OSEA’s key ratios are the result of the team’s focus on identifying companies with the following characteristics:
Profitability
Above average quality and strong margins
Growth
Higher earnings growth and return on equity
Quality
Lower balance sheet risk
| As of 12/31/23 | OSEA | MSCI ACWI ex USA |
|---|---|---|
| # Holdings | 28 | 2,312 |
| Active Share | 89% | - |
| 1 Year Turnover | 23% | - |
| Operating Margin 12M Trailing | 24.1 | 11.5 |
| Est 3-5 Year EPS Growth | 9.7 | 10.90 |
| ROE 12M Trailing | 19.08 | 13.98 |
| Net Debt / EBIDTA 12M Forward | 0.7 | 1.7 |
C WorldWide believes higher profitability and growth should compound earnings and drive performance over time.
Source: C WorldWide.
Important Information
For use with Institutions Investors only. Not for Public Distribution.
All investments involve risk including the possible loss of principal.
There is no guarantee that the investment objective of the Fund will be achieved. Stock markets are volatile and equity values can decline significantly in response to adverse issuer, political, regulatory, market and economic conditions. Investing in international and emerging markets poses special risks, including potentially greater price volatility due to social, political and economic factors, as well as currency exchange rate fluctuations. These risks are more severe for securities of issuers in emerging market regions. A non-diversified Fund may invest a greater percentage of its assets in securities of a single issuer, and/or invest in a relatively small number of issuers, it is more susceptible to risks associated with a single economic, political or regulatory occurrence than a more diversified portfolio.
The Subadviser considers certain ESG factors in evaluating company quality which may result in the selection or exclusion of securities for reasons other than performance and the Fund may underperform relative to other funds that do not consider ESG factors.
The MSCI All Country World Ex. US (ND) Index is a free float-adjusted market capitalization weighted index that is designed to measure equity market performance in the global developed and emerging markets, excluding the U.S. This unmanaged index does not reflect fees and expenses and is not available for direct investment.
In relation to any data attributed to Morningstar, please note the following: © Morningstar 2024. All rights reserved. Use of this content requires expert knowledge. It is to be used by specialist institutions only. The information contained herein: (1) is proprietary to Morningstar and/or its content providers; (2) may not be copied, adapted or distributed; and (3) is not warranted to be accurate, complete or timely. Neither Morningstar nor its content providers are responsible for any damages or losses arising from any use of this information, except where such damages or losses cannot be limited or excluded by law in your jurisdiction. Past financial performance is no guarantee of future results.
The Morningstar Rankings are based on total returns, with distributions reinvested and operating expenses deducted. Morningstar does not take into account sales charges. Harbor International Compounders ETF was ranked against Morningstar’s Foreign Large Blend category as percentile ranks, quarterly, over the following time periods: 33 out of 417 investments in the category for the 1-year period as of 12/31/2023.
Beta is a measure of the volatility - or systematic risk - of a security or portfolio compared to the market as a whole.
Correlation is a statistic that measures the degree to which two securities move in relation to each other.
The Est 3-5 Yr EPS Growth (%) is the estimated growth of earnings per share over the next 3-5 years, using pre-calculated mean long-term EPS growth rate estimates, which are calculated using each individual broker’s methodology, from FactSet, First Call, I/B/E/S Consensus, and Reuters. Forward looking estimates may not come to pass.
P/E or Price to Earnings ratio. Current prices divided by estimated future earnings over the next 12 months.
ROE is a measure of financial performance calculated by dividing net income by shareholders' equity.
Operating Margin is a measure of a company's overall profitability from operations.
EBITDA or earnings before interest, taxes, depreciation, and amortization is used as an indicator of the overall profitability of a business.
The views expressed herein may not be reflective of current opinions, are subject to change without prior notice, and should not be considered investment advice.
Investors should carefully consider the investment objectives, risks, charges and expenses of a Harbor fund before investing. To obtain a summary prospectus or prospectus for this and other information, visit harborcapital.com or call 800-422-1050.Read it carefully before investing.
Foreside Fund Services, LLC is the Distributor of the Harbor ETFs.
