 Contact
U.S. Small Cap Growth Equities
Opportunities & Considerations for 2024 & Beyond
February 06, 2024Jan 2004 -Dec 2023 (Computed Monthly)
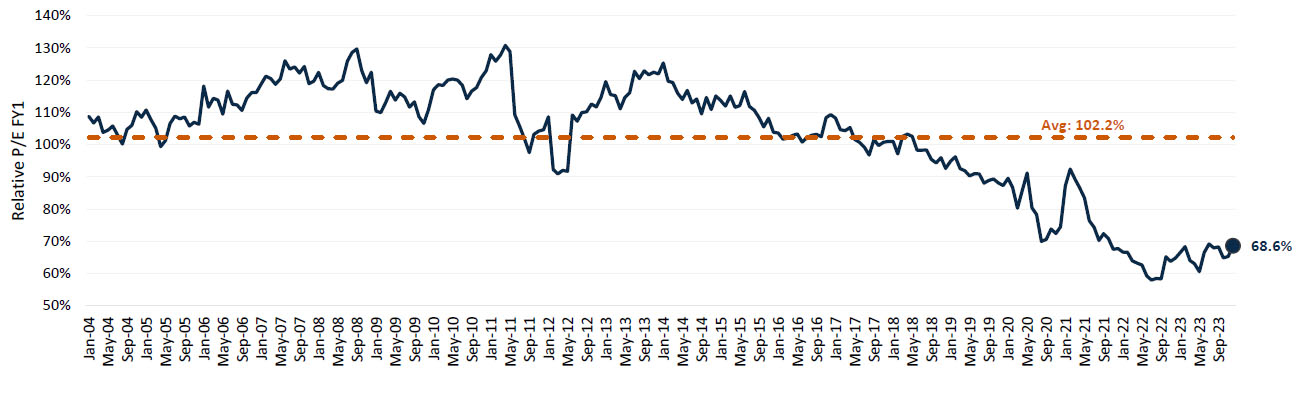
- The Russell 2000 Growth Index’s price/earnings FY1 of 20.1x was 68.6% of the Russell 1000 Growth Index’s price/earnings FY1 of 29.3x as of 12/31/2023.
- The Russell 2000 Growth Index / Russell 1000 Growth Index: Relative price/earnings FY1 was 33.6% below its 20-year average of 102.2% as of 12/31/2023, representing compelling relative valuation opportunity.
Jan 2014 -Dec 2023 (Computed Annually)
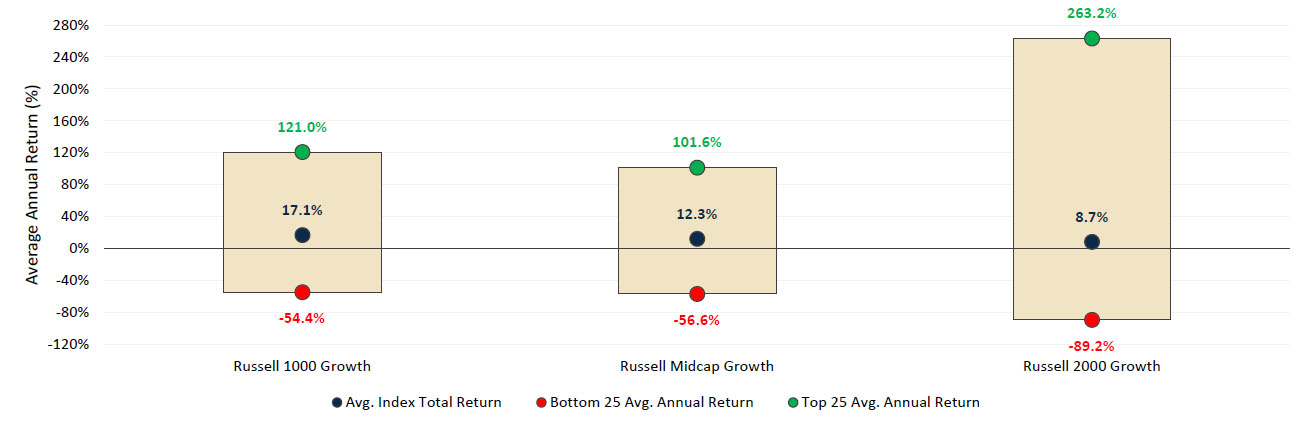
- U.S. small cap growth equities have also exhibited meaningfully higher levels of performance dispersion between their top and bottom 25 performers on an average annual basis over the last 10 calendar years relative to their large and mid cap counterparts (as of 12/31/2023).
- This suggests a stronger alpha opportunity set for active managers aiming to select winners and evade performance laggards within U.S. small cap growth equities.
Source: FactSet Research Systems. Performance data shown represents past performance and is no guarantee of future results.
Russell 2000 Growth -Russell 1000 Growth: Rolling 3YR Excess Returns
Jan 1994 -Dec 2023 (Computed Quarterly)
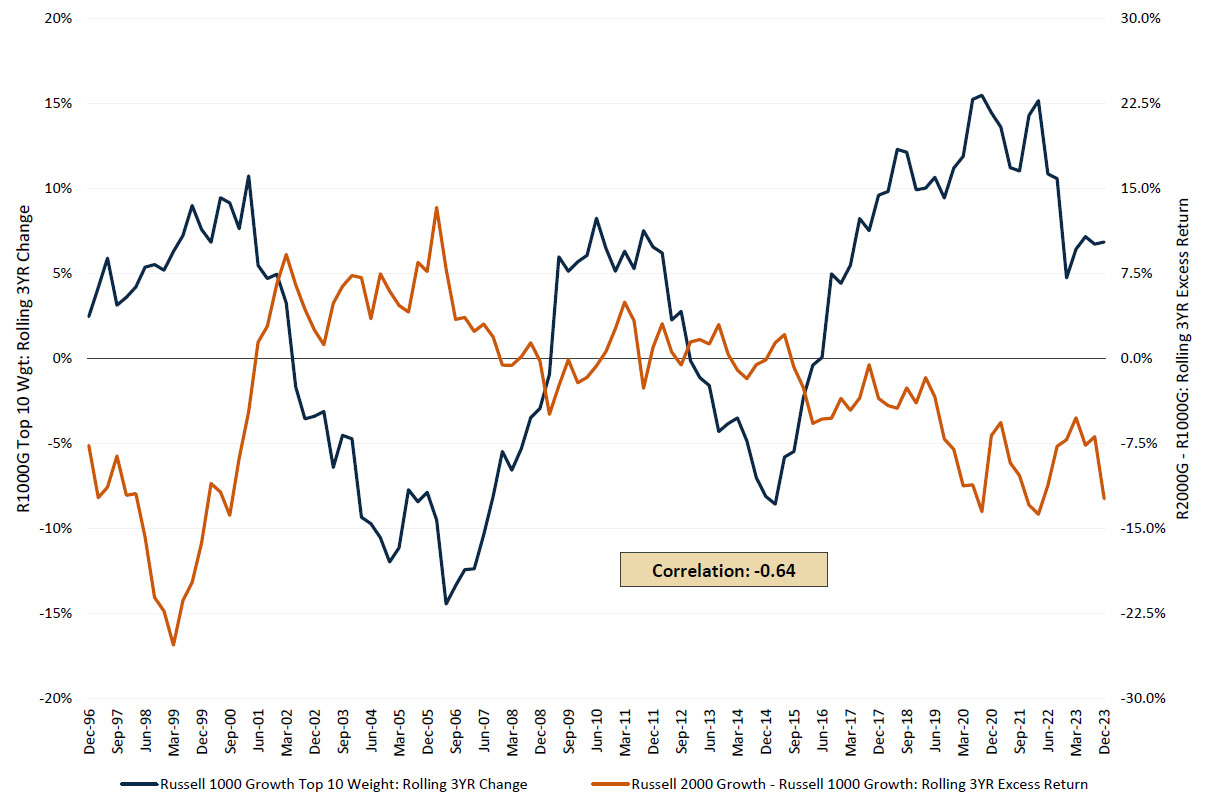
- Given the recent outsized returns of a handful of mega cap names, many investors are considering if it’s time to seek diversification down in market capitalization for an eventual broadening out of performance returns.
- The chart to the right shows that as Russell 1000 Growth Index concentration has fallen (such as in the early 2000’s), the Russell 2000 Growth Index has outperformed its large cap counterpart on a rolling 3YR basis.
- In fact, the rolling 3-year change in the Russell 1000 Growth Index’s top ten weight has exhibited a correlation of -0.64 to the rolling 3-year excess returns of the Russell 2000 Growth Index versus the Russell 1000 Growth Index over the last 30 years.
- This suggests that allocating to U.S. small cap growth equities at potential peaks of large cap growth index concentration could provide potential opportunities looking ahead.
Source: Morningstar Direct & FactSet Research Systems. Performance data shown represents past performance and is no guarantee of future results.
12 Month Excess Returns Following Recession End Dates
Jan 1979 -Dec 2023 (Monthly)
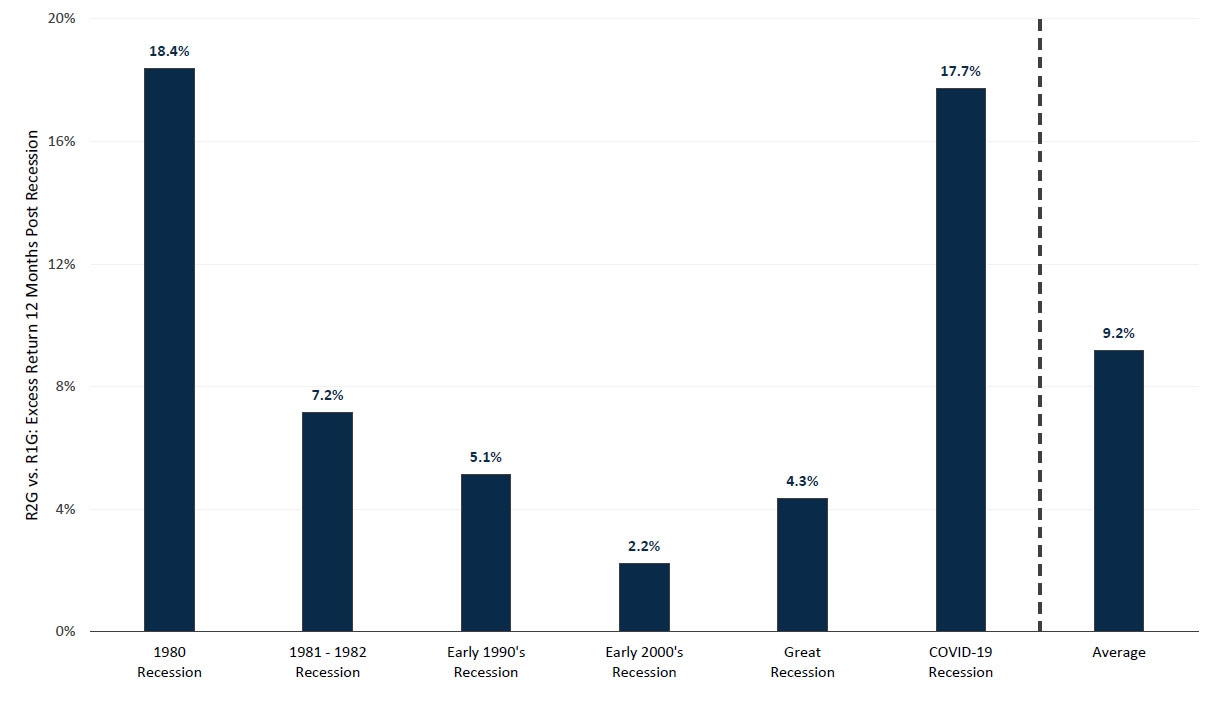
- Markets remain off balance given elevated uncertainty pertaining to the probability, severity, and duration of U.S. recession in 2024.
- U.S. small cap growth equities have exhibited performance advantage relative to their larger cap brethren exiting U.S. recessionary periods.
- In fact, the Russell 2000 Growth Index has outperformed the Russell 1000 Growth Index in all 12-month periods following the last six U.S. recessions, with an average excess return of 9.2%.
- With potentially better days “beyond the landing”, U.S. small cap growth equities may likely warrant increased investor attention for the road ahead.
Source: Morningstar Direct. Performance data shown represents past performance and is no guarantee of future results.
Jan 2019 - Dec 2023 (Computed Monthly)
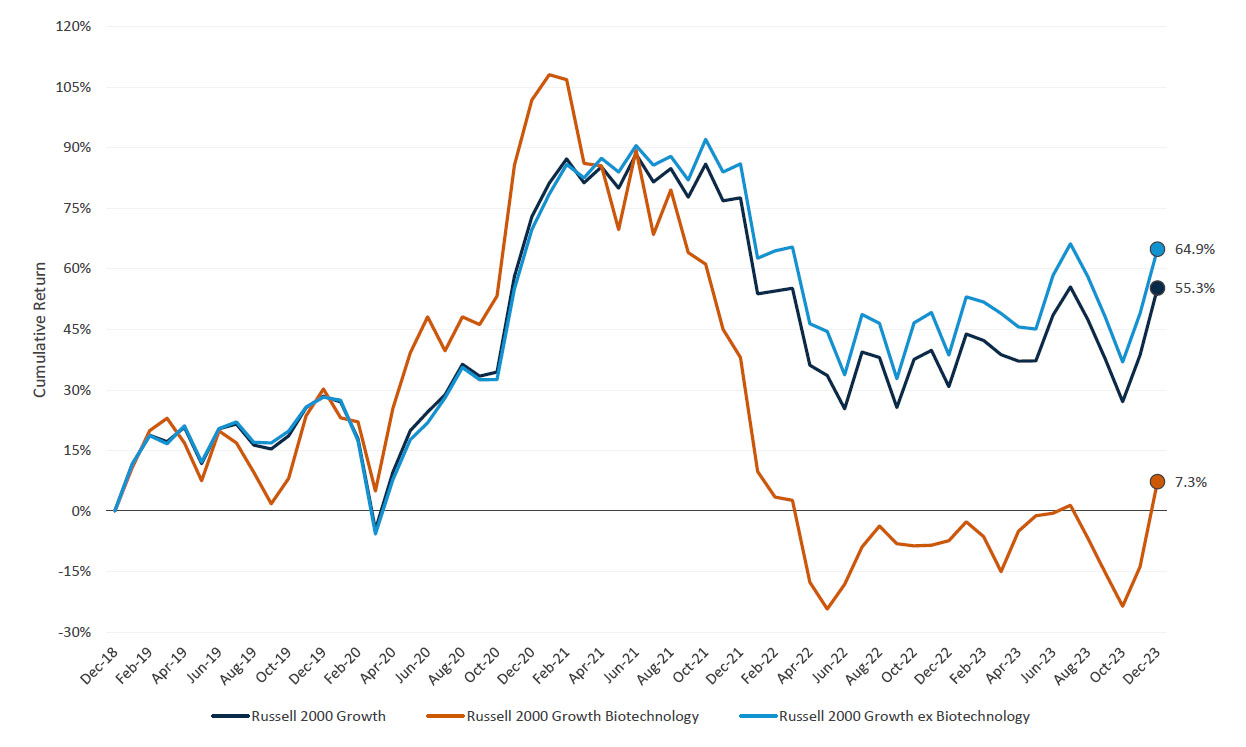
- The U.S. small cap growth equity space features, what we believe, are potentially promising companies with strong long-term growth and performance potential.
- However, small cap growth industries such as biotechnology also contain companies that generate negative earnings through temporary difficulties associated with their businesses or due to significant capital investments designed to drive future growth.
- Biotechnology represented the Russell 2000 Growth Index’s second largest industry weight as of 12/31/2023 (10.4%).
- This industry group meaningfully lagged the broader small cap growth market in 2021/2022 amidst elevated inflation and tighter financial conditions, dragging down overall Index returns over the 5-year period.
- Importantly, active U.S. small cap growth management enables differentiated industry positioning relative to the Index, as well as idiosyncratic alpha opportunities within more speculative pockets of the market such as Biotechnology.
Source: FactSet Research Systems. Performance data shown represents past performance and is no guarantee of future results.
Important Information
The views expressed herein may not be reflective of current opinions, are subject to change without prior notice, and should not be considered investment advice or a recommendation to purchase or sell a particular security.
Past performance is no guarantee of future results.
The Russell 1000® Growth Index is an unmanaged index generally representative of the U.S market for larger capitalization growth stocks. The Russell Midcap® Growth Index measures the performance of the mid-cap growth segment of the US equity universe. The Russell 2000® Growth Index measures the performance of the small-cap growth segment of the US equity universe. The Russell 1000® Growth Index, Russell Midcap® Growth Index, and Russell 2000® Growth Index and Russell® are trademarks of Frank Russell Company. These unmanaged indices do not reflect fees and expenses and are not available for direct investment.
© Morningstar 2023. All rights reserved. Use of this content requires expert knowledge. It is to be used by specialist institutions only. The information contained herein: (1) is proprietary to Morningstar and/or its content providers; (2) may not be copied, adapted or distributed; and (3) is not warranted to be accurate, complete or timely. Neither Morningstar nor its content providers are responsible for any damages or losses arising from any use of this information, except where such damages or losses cannot be limited or excluded by law in your jurisdiction. Past financial performance is no guarantee of future results.
Earnings per share (EPS) is the portion of a company's profit allocated to each outstanding share.
Investing entails risks and there can be no assurance that any investment will achieve profits or avoid incurring losses.
Diversification does not assure a profit or protect against loss in a declining market.
Harbor Capital Advisors, Inc.
3369943


